
Robotic ultrasonic inspections are quickly gaining popularity in a number of industries due to the efficiency and data density relative to other NDT methods. In industrial settings, robots inspect the critical infrastructure that society depends on, therefore it’s imperative that the resulting data is accurate, high quality, and actionable in order to keep the assets operating safely and optimally.
In NDT, ultrasonic testing data measures material thickness by determining the time-of-flight for the sound wave to penetrate the surface then echo off the back wall. A-scans represent the waveform data for one pulse. Multiple material thickness readings can form B-scans and C-scans which show trends in the data.
As UT technology in robotics has evolved, so have data visualization capabilities. Over the last few years, Gecko Robotics iterated on robot design and developed a suite of products aimed to give industrial operators the information necessary to make data-driven management decisions. The robots offer 1000x more data than traditional UT methods, generating thousands or millions of A-scan readings per inspection. Gecko utilizes the A-scans to create waterfall B-scans and 2-dimensional (2D) and 3-dimensional (3D) C-scans to understand the depth and severity of the damage.
But, with a high volume, unpacking the value of A-scan, B-scan, and C-scan ultrasonic data for decision making and asset management can be overwhelming.
Ultrasonic A-Scans
An amplitude Scan, or A-scan, is the most basic presentation of waveform data and represents individual sound pulses sent through the material tested. In a Gecko Robotics inspection, each A-scan is produced by a single sensor, with the most advanced robots containing 128 sensors with a data density of 1/4 inch x 1/4 inch (6mm x 6mm) and producing over 94,000 readings per ft2 (over 8,700 per m2).
An A-scan is a one-dimensional graph where ultrasonic echo amplitude is plotted as a function of time. In a healthy A-scan, the first, and tallest peak, is the interphase reflection. The second and subsequent peaks are back wall echoes. Using the speed of sound through the test material, the material thickness is determined by calculating the time elapsed between peaks one and two. The delay is how long it takes for the ultrasound wave to pass through the interface and it can be used to determine the distance between the probe and material.
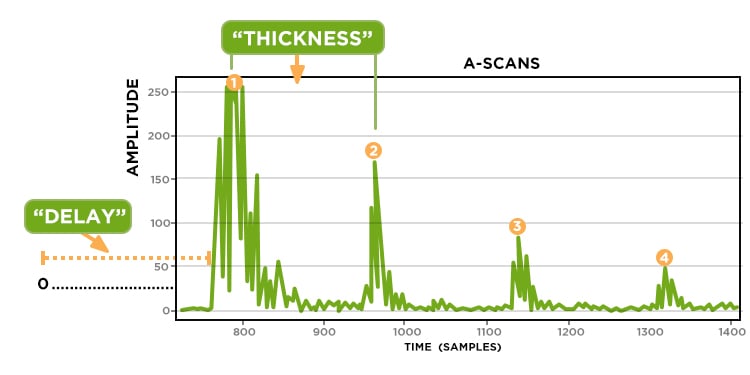
However, many A-scans are not perfect like the graph above. The shape it takes can determine the presence of damage mechanisms or errors such as poor sound transmission or connection. Gecko uses trained algorithms to measure the quality of the data with a focus on low quality readings. Those readings are invalidated and removed from the set, ensuring that the material thickness measurements generated from the millions of A-scans that remain are high quality and actionable, which is important because they are the building blocks for B-scans and C-scans.
Ultrasonic B-Scans
B-scans are two-dimensional, cross-sectional views of the inspected material depicting material thickness measured at different positions over time. In robotic inspections, B-scans display the A-scan readings that originate from a single sensor in a single run. They are used to show trends in the material and are regularly displayed in a scatterplot. However, it is important to note that a scatterplot is a biased representation of the data because it requires an algorithm to interpret the A-scan to quantify the material thickness measurement.
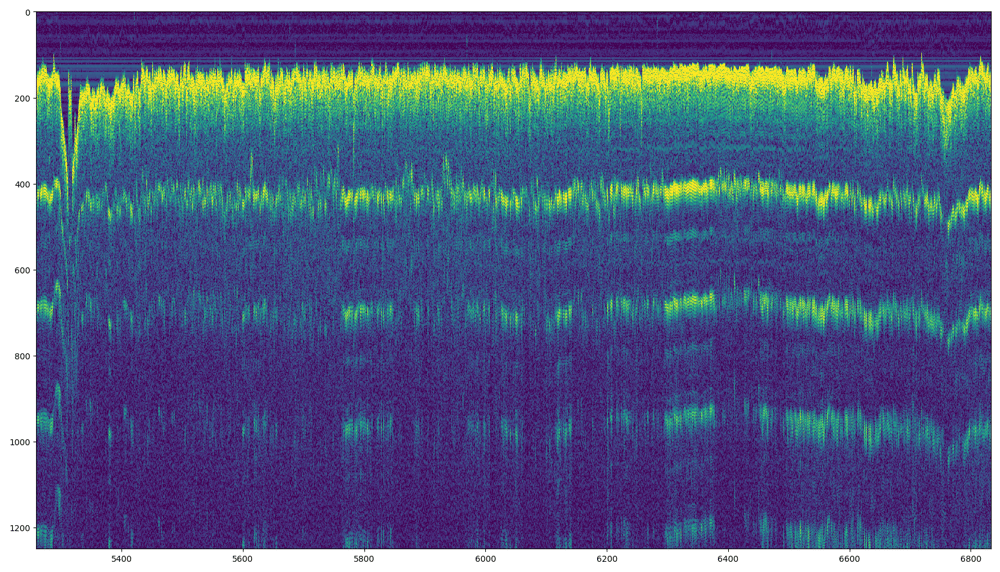
Alternatively, Gecko developed a different data visualization tool for B-scans: a waterfall plot. Taking a single A-scan, waterfall plots use color to represent amplitude where yellow is high amplitude and dark blue is low amplitude. For example, the bold yellow line at the top of the plot is the interface reflection. The plot can be used to examine multiple A-scans at once. Changes in scans over position become visual patterns in the plot, presenting a truthful and unbiased representation of the data.
The Gecko Robotics Inspection Team (GRIT) monitors the A-scans and B-scans generated by Gecko’s TOKA series robots as it crawls the asset. This is beneficial for two reasons: firstly, in real-time, they can fix some of the issues related to bad coupling or sound transmission. Secondly, the data generated is used to provide the customer a preliminary report immediately after the inspection is completed. Afterward, the customer receives a complete data analysis, C-scans, and report delivered through the online Gecko Portal®.
Ultrasonic C-Scans
A C-scan is one of the most sophisticated ways to view ultrasonic testing data. It is a three-dimensional representation of the material thickness plotted over position both horizontally and vertically. In essence, C-scans are visual maps that reveal patterns of degradation in the asset. The best C-scan visualization tools display overall trends as well as granular point-level data.
Gecko Robotics’ proprietary software for data visualization, Gecko Portal®, presents C-scans in 2D or 3D color-coded material thickness heat maps, where green represents measurements close to the nominal thickness and red represents wall loss below t-min. The maps are plotted from encoder data that captures location information as the robot scans the asset. Toggling over a specific area on the C-scan will display point-level summary information including, nominal wall thickness, warning thickness, thickness difference from nominal, and the associated image taken from the robot. This granularity into the level of damage at a given location is incredibly valuable for making preventative maintenance and management decisions.
The image below shows a 2D C-scan on the left and a 3D C-scan of the same asset on the right. In the 2D format, the asset is viewed in a planar representation. Alternatively, the 3D format gives an aerial perspective of its condition. In both formats, encoder information indicates where damage is located on the asset, allowing operators to pinpoint damage and identify trends or wear patterns.
Robotic inspections provide exponentially more data than traditional UT methods. Using an established process for evaluating A-scans results in a high-quality data set as the starting point for evaluating wider trends visible in B-scans and C-scans. Data visualization is a powerful tool for understanding the condition of an asset and for determining areas where damage is most severe. By leveraging the power of data at their fingertips, operators can make well-informed decisions about their assets which can equate to huge resource savings over time.